Your Temperature Measurement Experts
Technical Papers
Error Sources That Effect Platinum Resistance Thermometer Accuracy
Part 3: Stability
There are many sources of error that affect the performance of Platinum Resistance Thermometers (PRTs). These error sources are inherent in the design and manufacture of all PRTs, but the magnitude of the resulting error can vary greatly depending on the specific PRT design and environment that it is used in. It is important for users of PRTs to know and understand what these error sources are so they can make intelligent decisions related to PRT selection and use. The most common error sources fall within the following categories: Interchangeability, Insulation Resistance, Stability, Repeatability, Stem Conduction, Hysteresis, Calibration and Interpolation, Lead Wire Resistance, Self-Heating, Time Response, and Thermal EMF. This paper will discuss the topic of Stability.
Stability
Stability refers to the ability of a PRT to maintain its’ Resistance vs. Temperature (R vs. T) relationship over time as a result of thermal exposure. Both ASTM E1137 and IEC 60751 address resistance change due to thermal exposure, however the criteria are somewhat different. ASTM E1137 essentially states that the PRT must meet the resistance tolerance for a Grade A or Grade B sensor as applicable, after 4 weeks (672 hours) of exposure to the maximum rated temperature. While this is a well defined criteria, it essentially does not permit any change in the resistance unless the manufacturer held a tighter tolerance to account for the change. IEC 60751 states that the PRT can change at 0°C by the equivalent of 0.15°C for a Class A sensor and 0.30°C for a Class B sensor after 250 hours at maximum rated temperature. While this standard allows for an R vs. T shift outside of the original tolerance, the 250 hour duration may be quite short for estimating longer term effects. Both of these standards leave something to be desired with respect to stability. Many manufacturers state stability specifications more like the IEC 60751 standard, stating a maximum change at 0°C as a result of exposure to maximum rated temperature for a given period of time. These specifications typically do not require the PRT to remain within the original R vs. T tolerance after the exposure.
Given the information contained above, it may be possible to perform a comparison between PRTs, but it is likely insufficient for determining how a PRT will perform in actual use. In the case where the PRT is used continuously for one year (~9000 hours) at 350°C, what estimation of performance can be made if stability information of .15°C per 250 hours at 500°C is the only detail provided? Additional information regarding stability would certainly be beneficial.
The additional information that would be valuable for estimating stability error would be a set of specifications that state the change due to exposure to varying temperatures over varying intervals of time. Typically three or four temperatures including the maximum rated temperature, would be adequate to estimate stability. The graph in Figure 3-1 below gives a realistic representation of the stability of a typical industrial PRT at 5 different exposure temperatures.
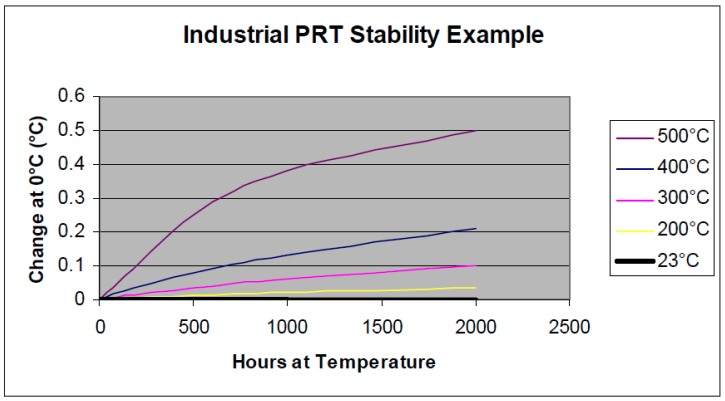
Figure 3-1
By examining Figure 3-1, a few generalizations can be made about the stability of this industrial PRT. These generalizations hold true for the behavior of most industrial PRTs, however the numbers, maximum temperatures, etc., will all be unique based on the specific PRT design. If a better understanding is needed regarding a specific PRT, the manufacturer of that PRT should be consulted.
- The resistance change due to exposure to room temperature and below can be considered negligible. Test results on several industrial PRTs have shown that the ice point resistance shift following 25,000+ hours at 23°C is less than .01°C. This is a very small change in comparison to other potential error sources.
- The magnitude of the change increases with increasing exposure temperature and is a maximum at maximum rated temperature. For example, the change after 1000 hours will be larger for an exposure temperature of 500°C than an exposure temperature of 400°C.
- The magnitude of the change is not linear with temperature and cannot be extrapolated beyond the upper temperature limit. For example, the change caused by exposure to 550°C cannot be reliably predicted based on the changes observed due to 500°C or 400°C exposure.
- The rate of change over time is fairly linear and remains fairly constant. For example, the change after 2000 hours can be approximated as twice the amount of change as was present after 1000 hours for the same exposure temperature.
- Given the generalizations above along with the information illustrated in Figure 3-1, a reasonably accurate estimation of stability can be made for the hypothetical example of a PRT at 350°C for one year. The stability can be estimated by looking at the graph and estimating a change after 1000 hours for a 350°C exposure. According to the graph, this would be approximately 0.1°C. Multiplying this number by 9 to determine the cumulative effect over 9000 hours gives a result of .9°C maximum change at 0°C after one year of exposure to 350°C. This is likely to be a more accurate estimate than extrapolating the IEC 60751 requirement of .15°C (or .30°C) per 250 hours out to 9000 hours which would result in an estimated value of 5.4°C (or 10.8°C)
Causes of Stability Error
Many factors can contribute to the instability of a PRT, but the most prominent source of instability is contamination of the platinum in the sensing element. Contamination can come from a variety of sources, such as metals that alloy with platinum at elevated temperatures, and very small amounts of these contaminants can have large effects on resistance. The materials and processes used to manufacture the sensor must be carefully selected and/or developed such that they have minimal affect on the platinum at temperatures up to the maximum rated temperature of the PRT. Cleanliness during manufacture is also critical as any foreign substance may become a source of contamination. In general, the materials, processes, and cleanliness become more critical as the maximum rated temperature of the PRT increases.
How to Reduce Stability Error
Since stability is controlled almost exclusively by the design and manufacture of the PRT, the best way to reduce stability error is to select a high quality PRT that has a low specified stability. When selecting a PRT, the stability must be considered for the maximum temperature of use, not necessarily the maximum rated temperature of the PRT itself since many PRTs are not used to maximum rated temperatures. Never expose PRTs to temperatures in excess of their maximum rated temperature without consulting the manufacturer first to determine the effect on stability. Also, avoid unnecessary exposure to elevated temperature, the less time the sensor is exposed to elevated temperature the smaller the cumulative effect.
As mentioned in Part 1 on Interchangeability, using a transmitter with “matching” capabilities can nearly eliminate interchangeability error and the same is true with stability error. Periodic calibration of the PRT and transmitter system can allow a transmitter to be matched to the newly characterized R vs. T relationship of the PRT. This can “calibrate out” the change of the PRT due to stability, and significantly reduce the cumulative effect of this error source.
Summary
There are many sources of error that affect the performance of a PRT. One of these sources is Stability, the ability of a PRT to maintain its R vs. T relationship over time as a result of thermal exposure. The most prominent source of instability is contamination of the platinum sensing element which can come from the materials, build processes, and foreign substances introduced during manufacture. The best way to reduce stability error is to select a high quality PRT that has a low specified stability and to minimize the PRTs exposure to elevated temperatures. Matching a transmitter to a PRT and periodically calibrating the system to adjust for changes can significantly reduce the cumulative effect of this error source.